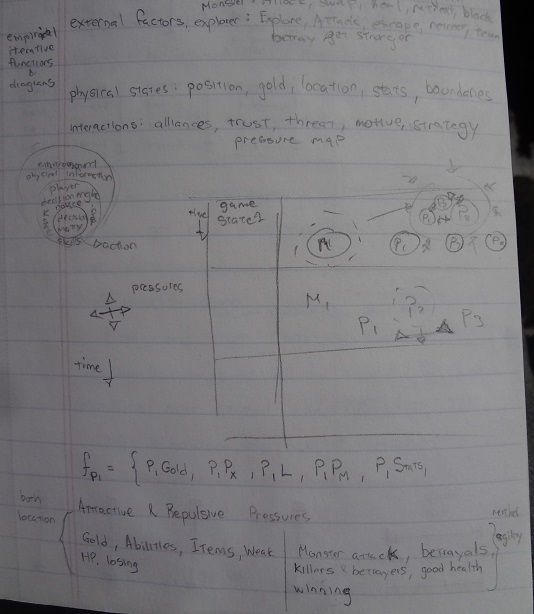
Eventually I came to using two diagrams that worked together. One was a player decision engine and the other was a pressure map. The player decision engine was a pathway of how the player made decisions from what cues from the game were given to what the player understands and previously formed mentalities (min-maxing, gamer psychology (see bartle test), relationships to other players, etc.), to available options resulting in a chosen action. The pressure map would represent the dynamics of how players influenced each other in the game.
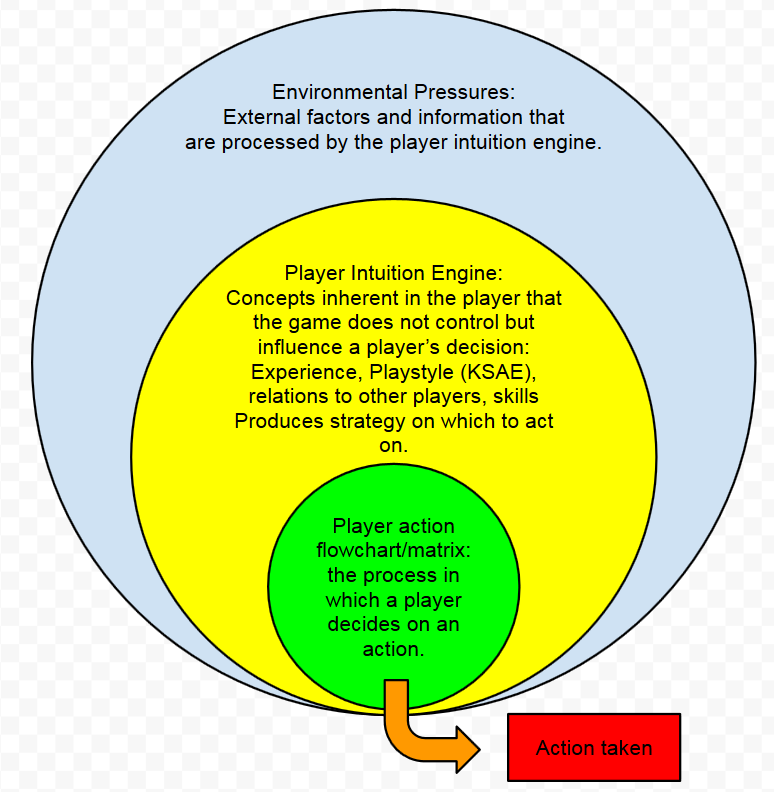
The final player decision engine appears below:
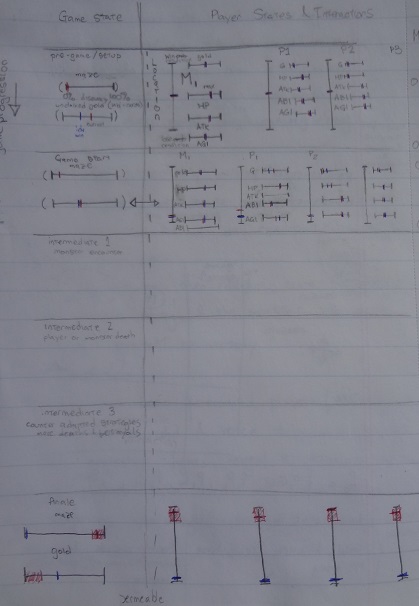
To explain the pressure map in more detail, the first column consists of information about the game. How much of the maze has been explored and how much gold is present and thus what is the economy of the game. The second column consists of all the different player interactions. Each row is a different part of the game. For example, in the first row of the second column is the very start of the game. Assuming no prior rivalries/companionships established, each player starts equidistant from each other horizontally. Horizontal distance also represents proximity of players in the game to each other. Each player also starts with the same amount of resources so each player starts at the same vertical level as each other. At first, if the monster is much stronger than all the other explorers, he or she would exert a very strong pressure on all three explorers pushing them close to one another increasing the odds that they will form an alliance to combat the monster. Each player wishes to move towards the top as that is their win condition. In the second column second row, player 2 or P2 has advanced further than the other players leaving a vacuum behind them which encourages P1 and P3 to band together. The monster player is further away so P1 and P3 join forces to create a pressure force that attempts to pull P2 back down.
If at the start there were any rivalries, some players would push the other player further away. If there were companionships, then players would gravitate toward one another. If any one player were to gain significant strength over the others, they would likely force the players to move away from them and closer to one another. Introducing new elements anywhere at any time game could be tracked by its strength and polarity. (how strong of a repulsive or attractive element it was). Thus adding a significant amount of gold in say the middle of the game may produce a very attractive force to some of the players who were not close to winning and that force may pull them away from attacking the player in the lead if it was that much more lucrative. Analyzing playtests would help determine exactly how much it took to create such an attractive pressure but at the very least, I was satisfied with this new map and I had a theoretical function for how players would interact with one another.
Individual entities in the pressure map are represented as circles as is the entire player decision engine. It is in this way that both diagrams are connected. The pressure map is a useful tool for gauging overall effects in the game and how players would stand respectively to one another. The player decision engine is best used to analyze what one specific player thinks and how they decide upon an action. While that action isn’t recorded in the pressure map, it’s effects are from small decisions that only affect the player themselves or an action that affects other players and form alliances or conflicts.
While this combo of a pressure map and player decision engine worked very well in analyzing emergent strategies, dynamics between the players, states in the game and relationships between the players, the one thing that was missing was the actual stats of the players which made it hard to look at a specific point in the game to work backwards and analyze other scenarios such as what if players reached the same point in the game but instead, we reversed the strengths of the different players. As such this stat chart was created and comprised of many sliders to describe all the specific quantifiable elements in the game.
The combination of this stat chart with the pressure map results in the final pressure map as follows:
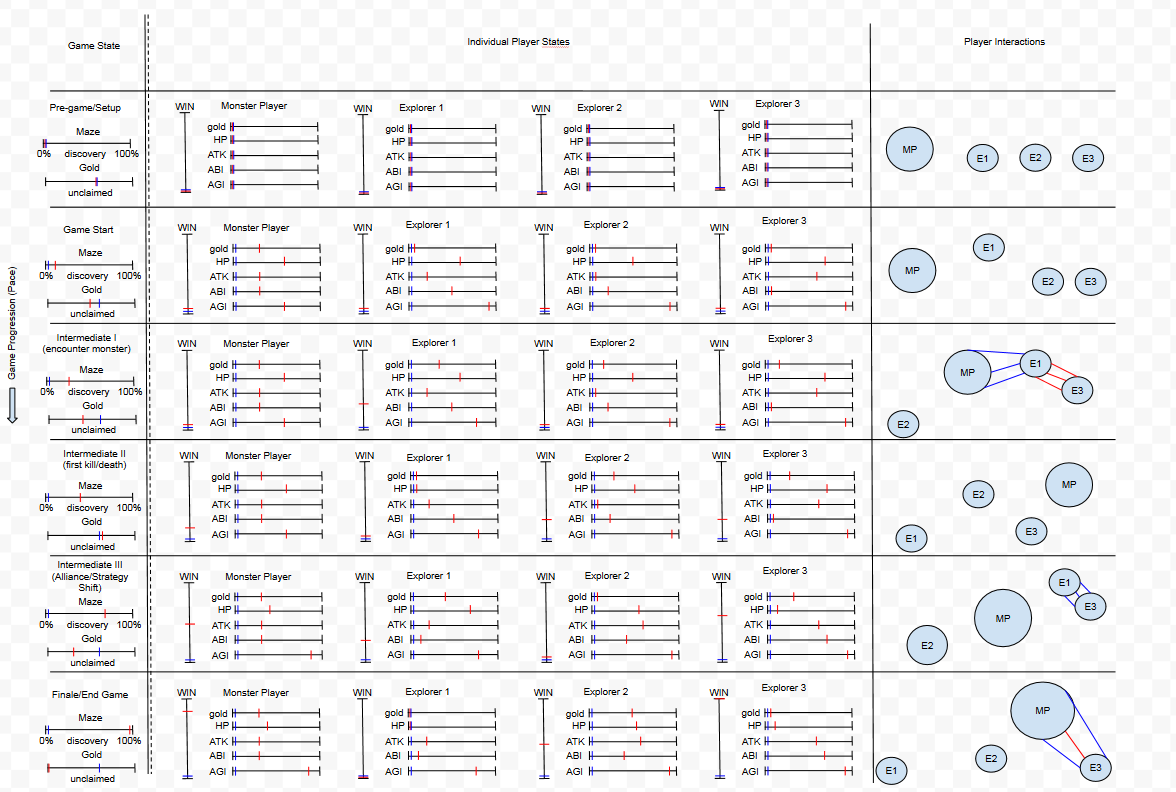
Since it was confusing to track player proximity with each other as well as player interaction with one another on the same horizontal axis, the horizontal axis only tracks player proximity with one another and new lines are formed to indicate formed connections (blue for attractive force, red for repulsive. Inner links are for the player whose turn comes first and outer links are the subsequent player’s connection. For example, the red connection between the monster player and explorer 3 is the explorer retreating from the monster while the blue links are the monster’s as the 3rd explorer has weak health and thus is a very easy target for the monster player. Connections not quite solid yet are represented by dashed lines but this particular session map was fairly quick and connections arose very quickly due to different pressures in the game. You can also observe that the monster player grew in size as their strength grew indicating a far more formidable pressure entity.
COMMENTS